Few things annoys me as much as claiming that the results of people show a Gaussian distribution: most people have average results and as you move to the extremes, you get less and less people. There is no doubt that the abilities of people follow a Gaussian distribution: our IQ, our strength follow it. In games the amount of time real life allows us to play also. The "results are Gaussian" claim is merely saying "your results depend on your resources". If you play better, you surely played more. If you have better job, you were lucky to have high IQ and a high-earner family to get you to college. Saying "results are Gaussian too" is saying "your results are out of your control".
To disprove it, I started to collect results. It wasn't easy to get unbiased, straightforward dataset. The idea came from my girlfriend: Megaera. This is a very simple raidboss in World of Warcraft for damage dealers: stand where everyone else, shoot what everyone else, minimal "dancing" and even that is ignored in LFR. The Patchwerk of Pandaria. So I resubscribed WoW (just for this project, don't dream EVE players!) and went to kill Megs. 25 times in the same lockout (the week before the patch):

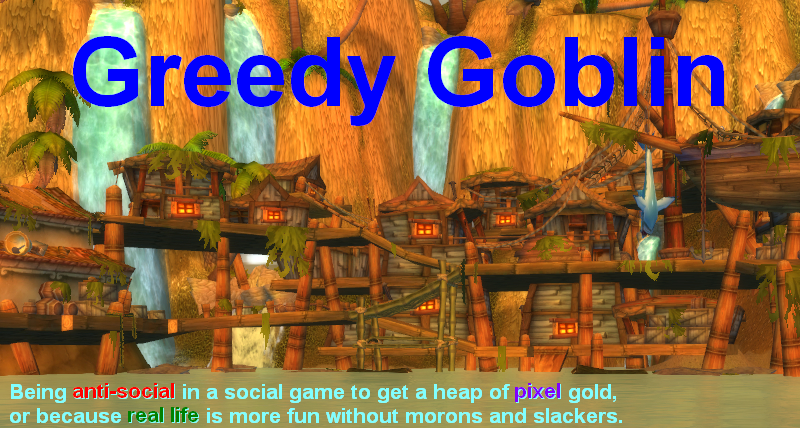
With that said, the average, rounded DPS of the dataset is 65K with the sigma of 20K. I divided the players into half-sigma (10K) wide groups, so the middle group with the name "65" means those who had between 60 and 70K DPS. The left column is to be read "between 0 and 30" instead of "between 20 and 30" while the rightmost is "100 and above". The results are these:
What is this "DoubleGauss"?
This is the point when - instead of being satisfied that I was right - I double-checked everything because I did not want to believe it: the brown "scrub-player" Gaussian has 21% weight only. I - along with most good players - expected to see a small "elite" next to the large group of "n00bs". Instead I found that the good and average players belong to the same dataset, and the scrubs are the small minority that doesn't belong.
This is probably while Blizzard is losing customers: everyone - including myself - believed that the majority of the players is bad and catering to them is a good idea to make the game popular. But no, they are a small, but vocal minority. When Blizzard dumbed everything down to their level, they served this minority against the majority. While there are bad players who belong to the majority, they are indeed newbies and very low playtime players, who are like us, therefore don't need freebies, just shorter timespan content and more materials to learn.
The above graphs don't tell who are the "scrubs" besides two facts: they are unlike the majority and they suck at WoW. Tomorrow we'll see who they are.
To disprove it, I started to collect results. It wasn't easy to get unbiased, straightforward dataset. The idea came from my girlfriend: Megaera. This is a very simple raidboss in World of Warcraft for damage dealers: stand where everyone else, shoot what everyone else, minimal "dancing" and even that is ignored in LFR. The Patchwerk of Pandaria. So I resubscribed WoW (just for this project, don't dream EVE players!) and went to kill Megs. 25 times in the same lockout (the week before the patch):
With that said, the average, rounded DPS of the dataset is 65K with the sigma of 20K. I divided the players into half-sigma (10K) wide groups, so the middle group with the name "65" means those who had between 60 and 70K DPS. The left column is to be read "between 0 and 30" instead of "between 20 and 30" while the rightmost is "100 and above". The results are these:
What is this "DoubleGauss"?
This is the point when - instead of being satisfied that I was right - I double-checked everything because I did not want to believe it: the brown "scrub-player" Gaussian has 21% weight only. I - along with most good players - expected to see a small "elite" next to the large group of "n00bs". Instead I found that the good and average players belong to the same dataset, and the scrubs are the small minority that doesn't belong.
This is probably while Blizzard is losing customers: everyone - including myself - believed that the majority of the players is bad and catering to them is a good idea to make the game popular. But no, they are a small, but vocal minority. When Blizzard dumbed everything down to their level, they served this minority against the majority. While there are bad players who belong to the majority, they are indeed newbies and very low playtime players, who are like us, therefore don't need freebies, just shorter timespan content and more materials to learn.
The above graphs don't tell who are the "scrubs" besides two facts: they are unlike the majority and they suck at WoW. Tomorrow we'll see who they are.
8 comments:
Very interesting results. Could you provide your raw data, maybe as a Google spreadsheet?
If I had any idea how to do that, I would.
However I can e-mail it to you, it's not that big.
Quite good analysis.
I've myself reloaded my wow account few month ago and i feel the same but it's because of the human nature itself.
When you considere yourself "at the top" you only notice (or maybe you notice far more) the noob people and the weirdest situation.
What makes you think there are a lot of noob is not an average distribution, it's a particular situation when you get 50% of your lfr filled with noob.
You point the noobiness of people in lfr by it's far far worse in PvP.
Lot of people imagine they are good simply because they make lot of kill/damage (even the good stuff one) and though lose the bg quite fast cause 50% of the team isn't playing for the objectives.
@Gevlon
"If I had any idea how to do that, I would."
1) Go to https://drive.google.com
2) Upload your spreadsheet file (it understands most common formats)
3) Open it from there in Google Docs
4) In the upper right corner there will be big blue button with access control
5) Change the access level to "Anyone" or "Anyone with the link" (it's "Personal" by default). The link itself will be on top of the window.
6) You are done, your spreadsheet is avaliable read-only to anyone you provide with the link. Works with most office document formats as well.
DPS: last I checked, the meter personalizes fight lengths. I think it assumes that if you're asking about DPS, you want to know who will usually do more damage, not who did the most this particular time. The latter is already listed.
-
I'm weakly confident there's a third, tiny Gaussian in the 100+ range, part of a group that almost never goes to LFR.
The reason it appears to you that almost everyone is a moron or slacker is that you're in this third group. From this vantage, the middle group looks pretty bad. As bad as the bottom group looks to the middle. It's easy to tell them apart in practice, because they're culturally different. Attitudes, usage of 'lol' and so on.
Or so the prediction goes. I'll see if it stands up to the next post.
Quite interesting, but you have to keep in mind for whom LFR is made: those who can't play in normal or even heroic raids.
I'm not saying they will never go LFR but those players are present until they get the items they need and never come back.
You can observe the same on reset day when the better players queue and you progress at a higher speed and less wipes than the rest of the week.
Another problem is of course LFR itself. It doesn't require your best so you can slack and leech, and many do.
Did you attempt chi-square test to prove your hypnotises? Dataset seems big enough for that.
Sure, email me the raw data if you can. My address is rverghes@gmail.com.
Post a Comment